Every oil crisis looks chaotic in real time. Prices surge, headlines scream, politicians scramble. But zoom out far enough and the structure emerges: the same levers get pulled in roughly the same order, with roughly the same lag times, crisis after crisis. Diplomatic pressure first, then strategic reserves, then OPEC, then sanctions adjustments, then — if none of it works — demand destruction and recession.
The question is never what governments will do. The question is whether the tools still work when they've been partially spent. In 2026, with the Iran conflict driving crude past $100, that question has become urgent.
Anatomy of a Spike
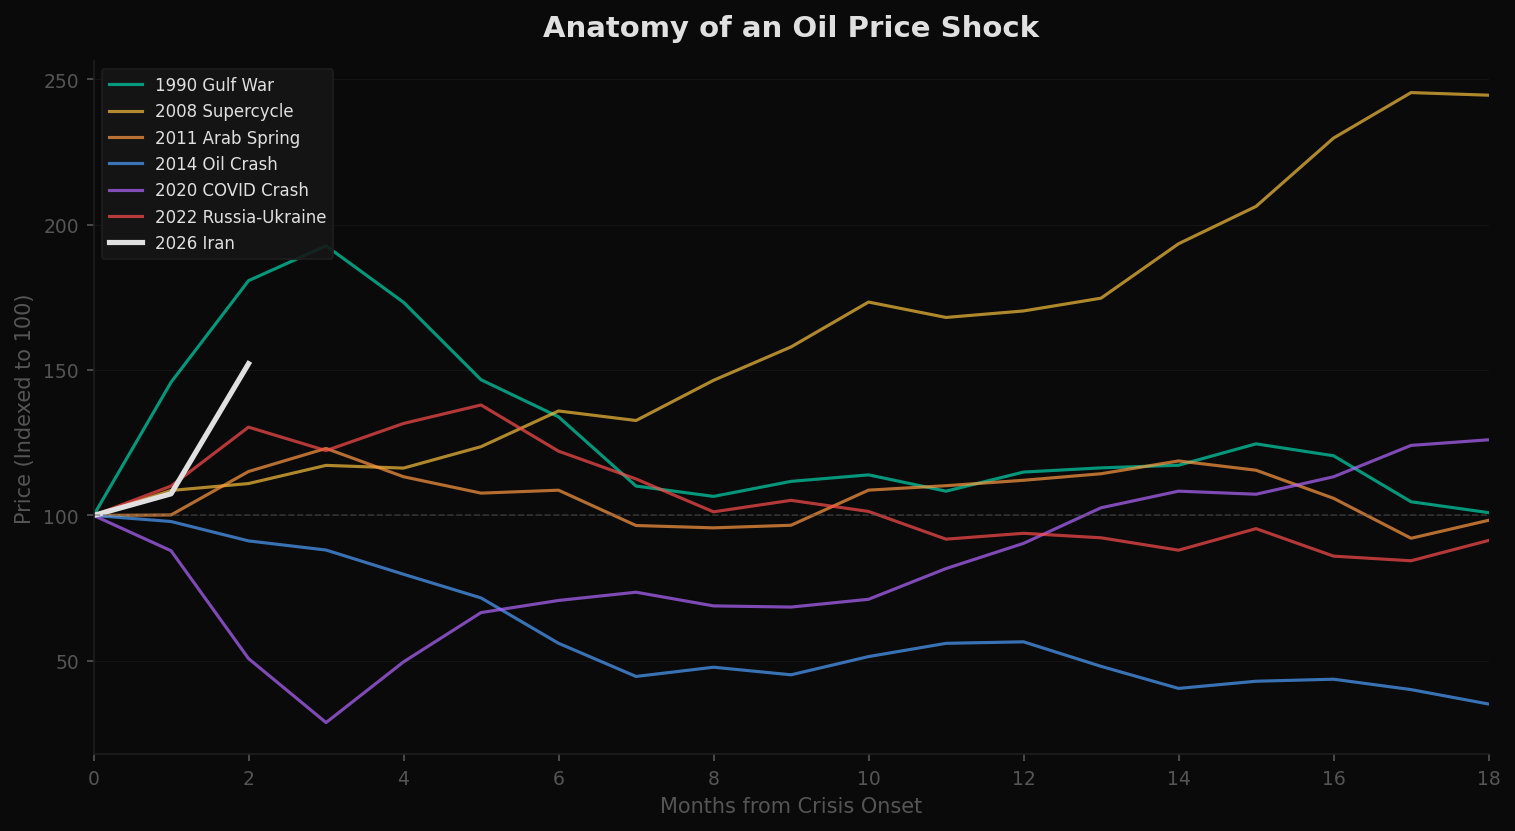
The chart below normalizes every major oil price shock since 1990 to a common starting point. Each line begins at 100 on the day the crisis hit and tracks the subsequent 18 months. The shapes are different — the Gulf War was a spike and collapse, the 2008 supercycle was a slow grind higher — but the anatomy is consistent: initial shock, overshoot, lever deployment, eventual mean reversion.
The white line is 2026. It is still being drawn.
The Lever Sequence
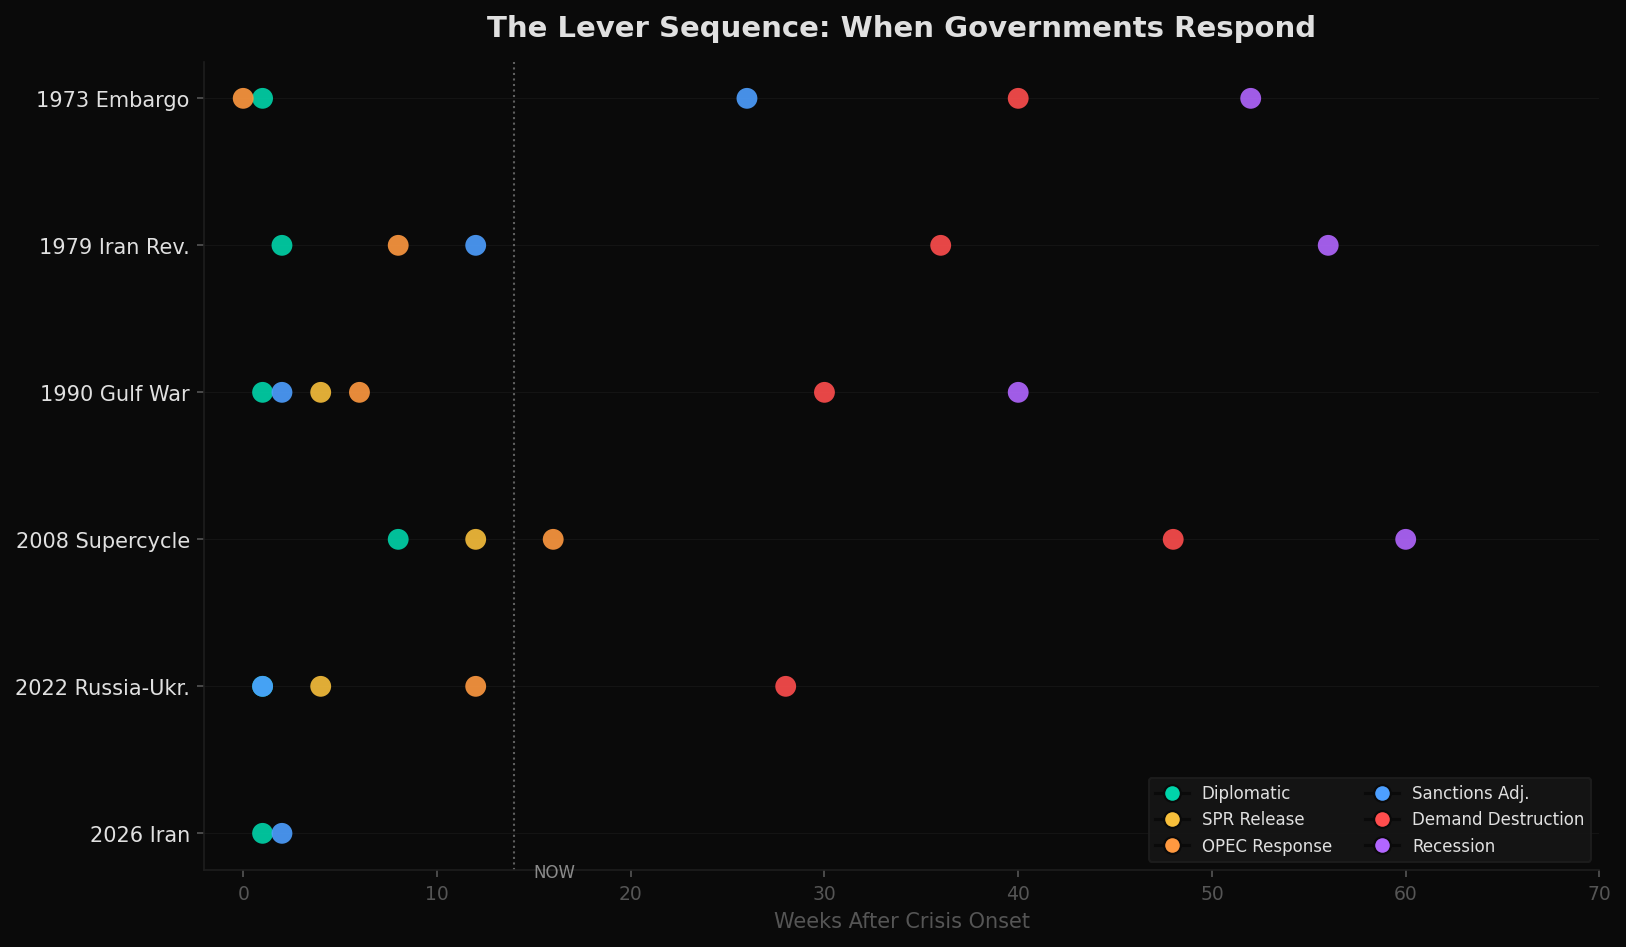
Across six major oil crises spanning five decades, the policy response follows a remarkably consistent sequence. Diplomatic pressure arrives within days. Strategic reserve releases follow within weeks. OPEC production adjustments take weeks to months. Sanctions modifications unfold over months. And if all else fails, demand destruction — the market's own lever — kicks in over quarters, sometimes followed by recession within a year.
The 2026 row is sparse. Diplomatic channels and sanctions adjustments have been activated, but the heavier tools — SPR releases, OPEC production increases — remain unused. Whether that reflects strategic restraint or depleted options is the central question.
The Strategic Reserve: A Depleting Tool
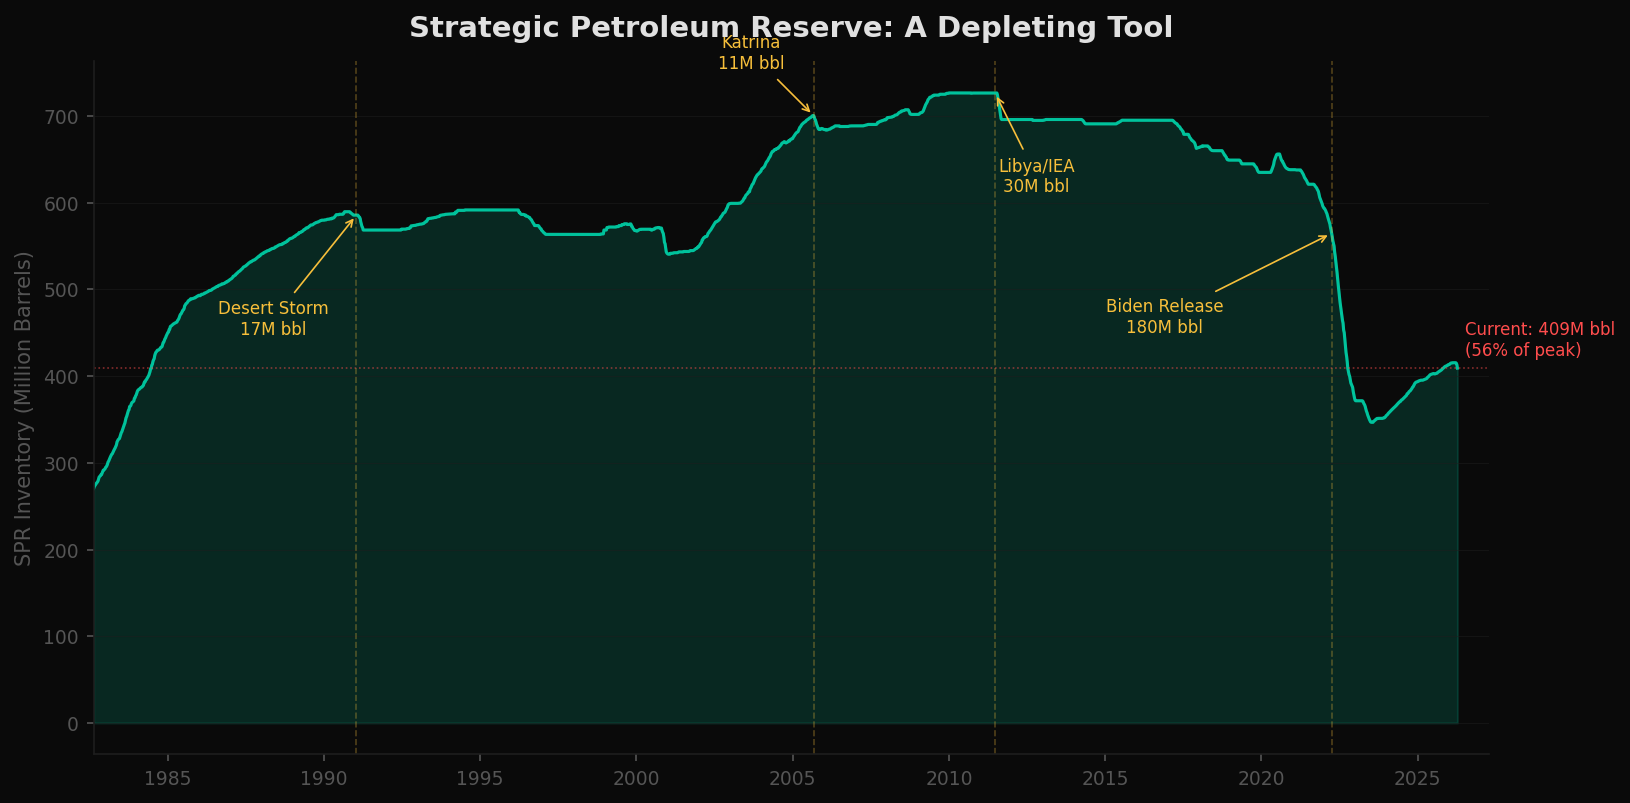
The Strategic Petroleum Reserve was created in the aftermath of the 1973 Arab oil embargo as a buffer against exactly this kind of crisis. It peaked at 727 million barrels in 2009. Today it holds roughly 413 million — 56% of its peak — following the largest drawdown in its history: the 180-million-barrel release in 2022 in response to the Russia-Ukraine price spike.
The SPR has been tapped four times for emergency releases. Each time, the price impact was real but temporary. The tool works — but each use leaves less in reserve for the next crisis. At current levels, a release comparable to 2022 would drain the reserve to levels not seen since its first decade of operation.
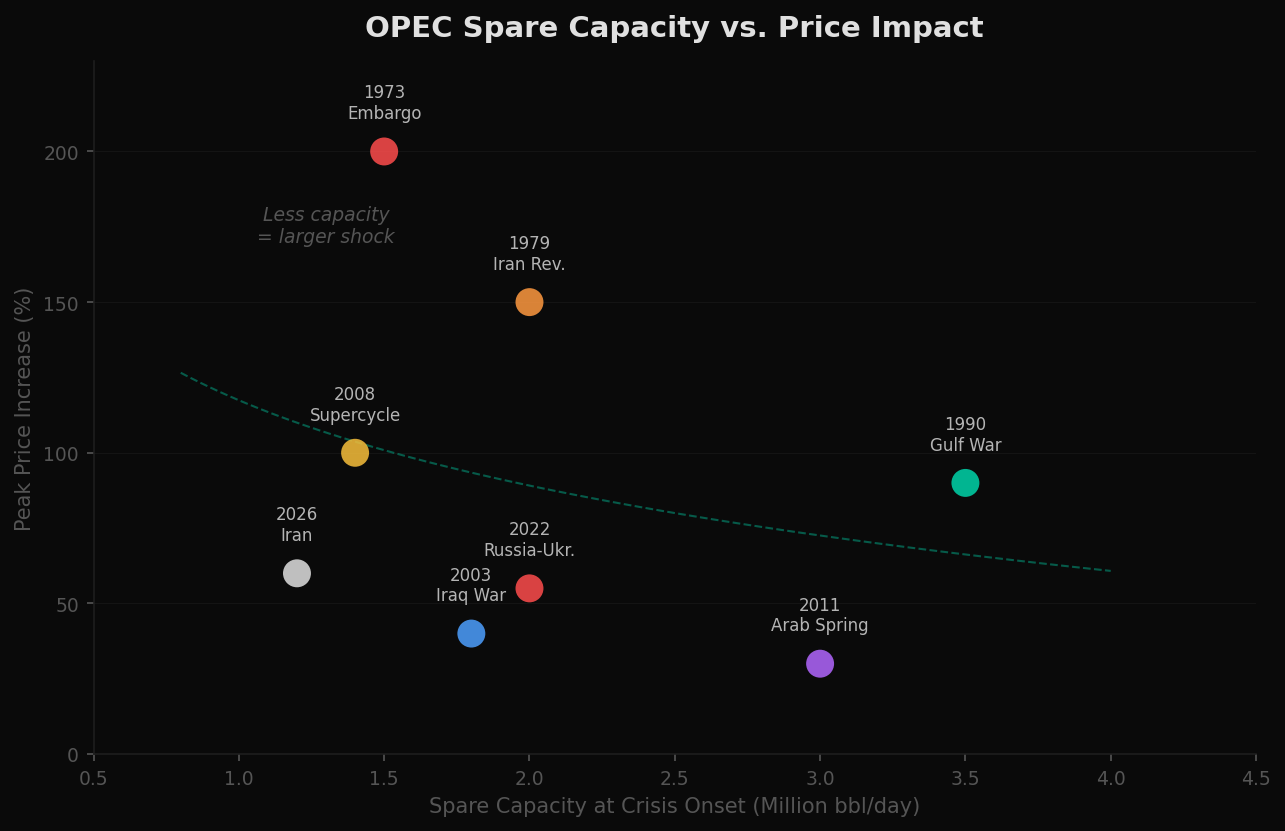
OPEC's Spare Capacity Problem
When OPEC has significant spare production capacity, it can credibly promise to flood the market and cap prices. This worked in the 1990 Gulf War, when 3.5 million barrels per day of spare capacity helped contain what could have been a much worse shock. It worked again in 2011 during the Arab Spring.
When spare capacity is thin, the same announcements ring hollow. The 1973 embargo and 2008 supercycle both occurred with spare capacity below 1.5 million barrels per day — and both produced the largest price increases in the dataset. Current estimates place OPEC spare capacity at approximately 1.2 million barrels per day, the lowest level entering any major crisis in the modern era.
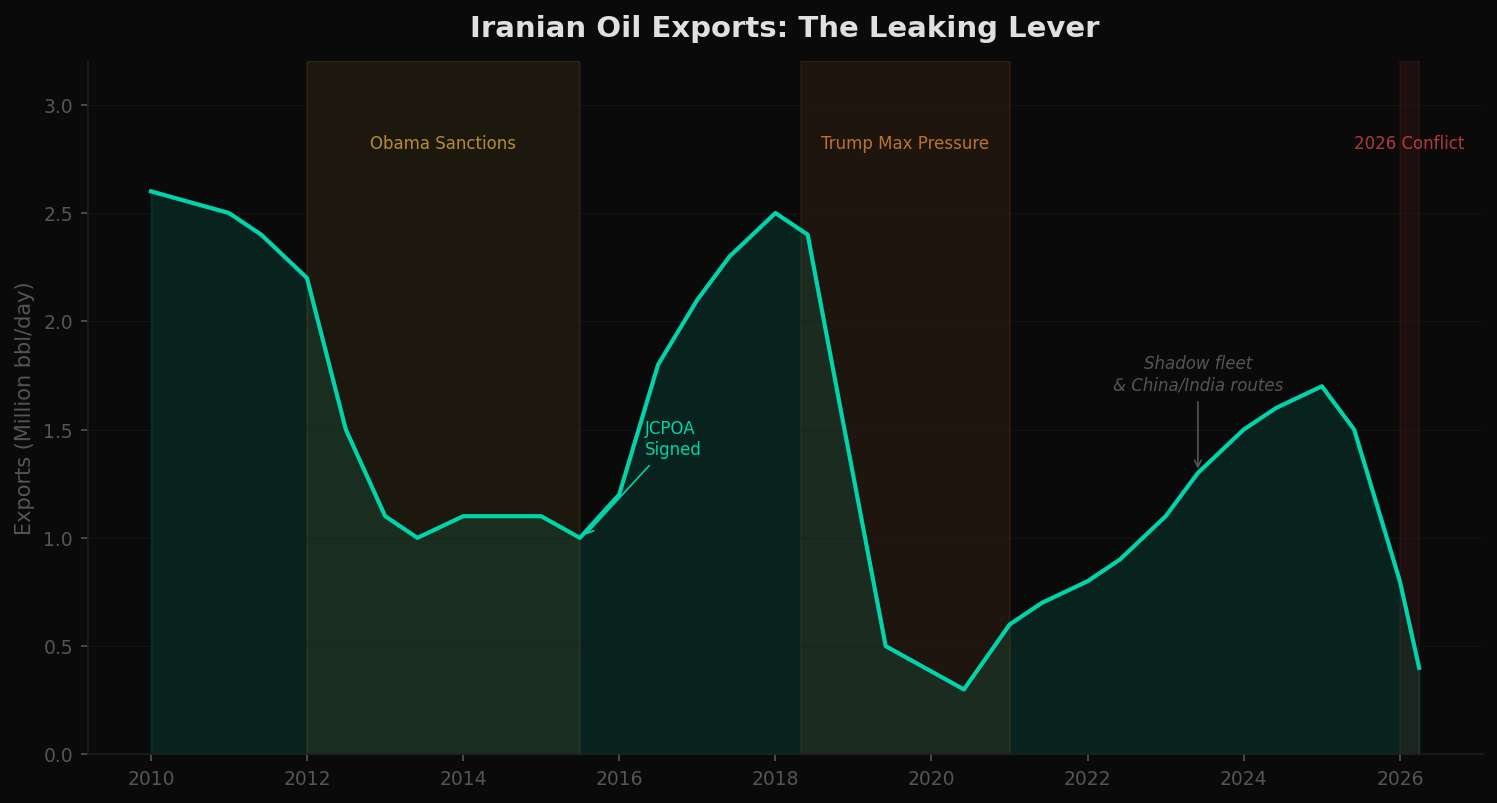
Sanctions: The Leaking Lever
Iran has been under some form of oil sanctions for most of the past fifteen years. The Obama-era sanctions (2012–2015) cut Iranian exports from 2.5 million barrels per day to roughly 1 million. The JCPOA lifted them temporarily. Trump's "maximum pressure" campaign drove exports below 500,000 barrels per day by mid-2019.
But sanctions leak. By 2024, Iranian exports had climbed back above 1.5 million barrels per day despite technically remaining under sanction — routed through shadow fleets and sold primarily to China and India at discounted prices. The 2026 conflict has disrupted these flows again, but the pattern is clear: each successive sanctions regime is less effective than the last as alternative infrastructure matures.
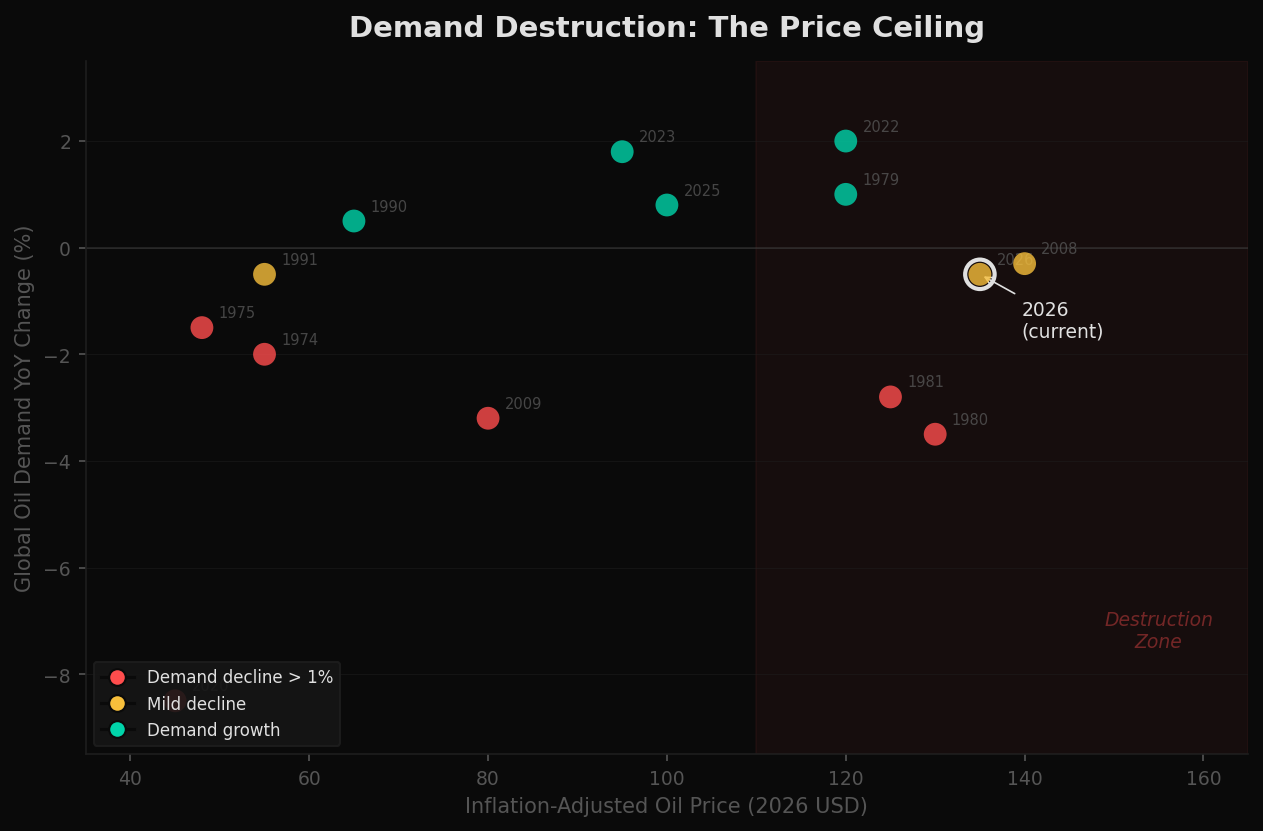
Demand Destruction: The Price Ceiling
When policy levers fail to contain a price spike, the market has its own mechanism: demand destruction. At some price threshold, consumers and industries reduce consumption — driving less, switching fuels, deferring investment. This is the ultimate ceiling on any oil price spike, but it comes with economic pain.
Historically, sustained inflation-adjusted prices above roughly $110–130 per barrel (in 2026 dollars) have been associated with measurable demand declines. The 1980 and 1981 episodes — following the Iranian Revolution — saw demand drop 3–4% year over year. The 2008–2009 episode triggered a 3.2% decline. Current prices are entering the lower end of this destruction zone, but demand has not yet responded. Whether efficiency gains and electrification have shifted the threshold higher, or whether the response simply lags, is an open question.
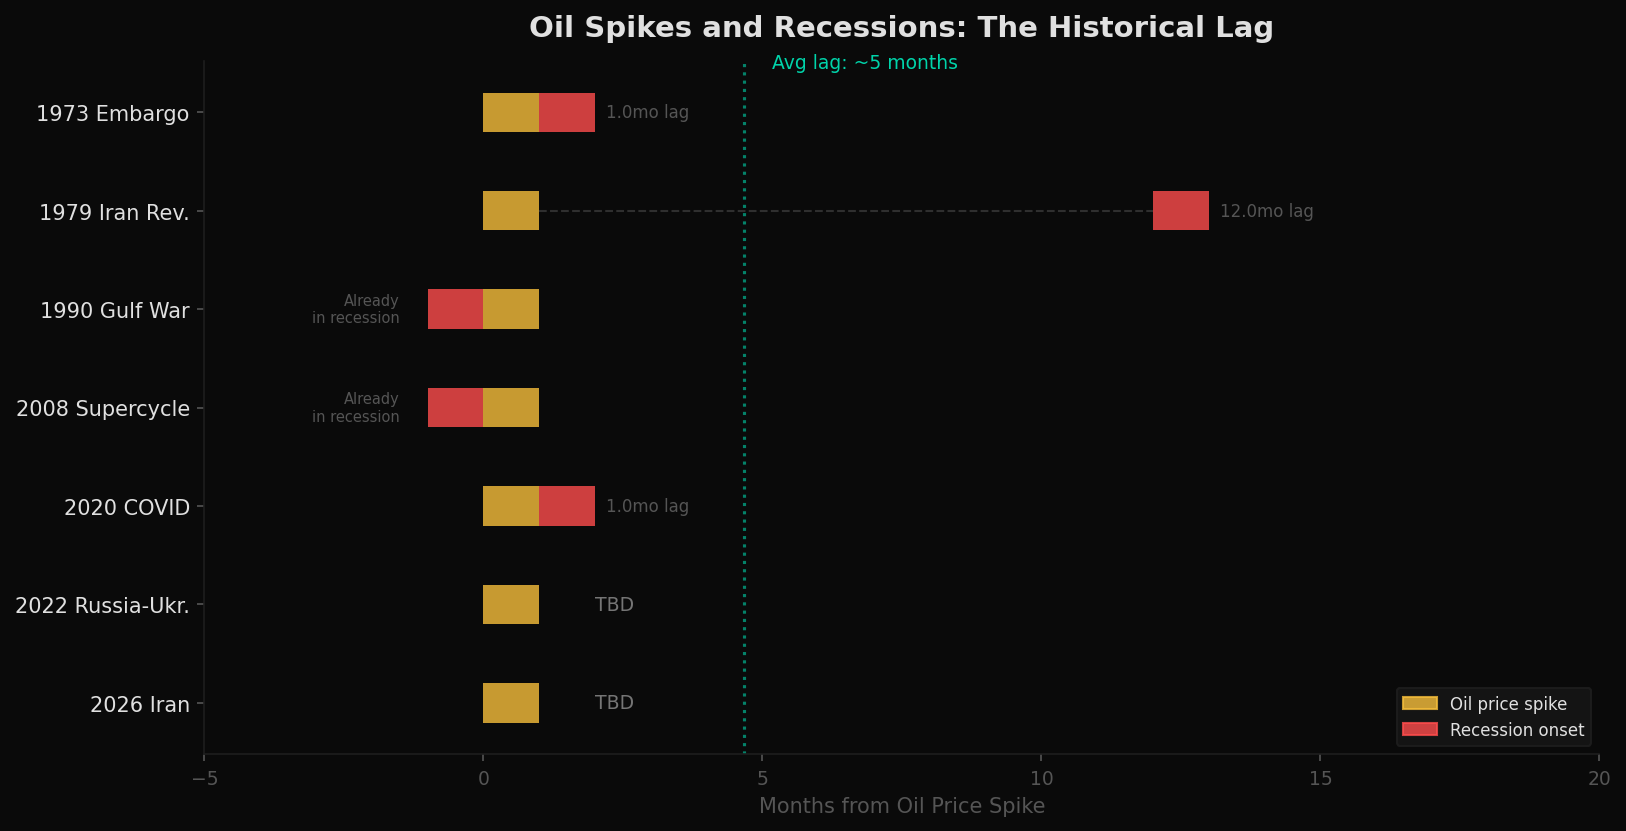
The Recession Question
Not every oil spike causes a recession, but the correlation is hard to ignore. Of the five major spikes before 2022, four were followed by a recession — with lags ranging from near-immediate to about twelve months. The 2022 Russia-Ukraine spike did not produce a recession, though it contributed to the most aggressive monetary tightening cycle in decades.
The historical average lag between a major oil shock and the onset of recession is approximately five months for those crises where recession followed. The 2026 crisis is now roughly four months old.
Where We Are Now
The playbook is known. The levers are identified. The question is how much force remains behind each one. The dashboard below presents the current "charge level" of each major policy tool compared to its historical average at the onset of past crises.
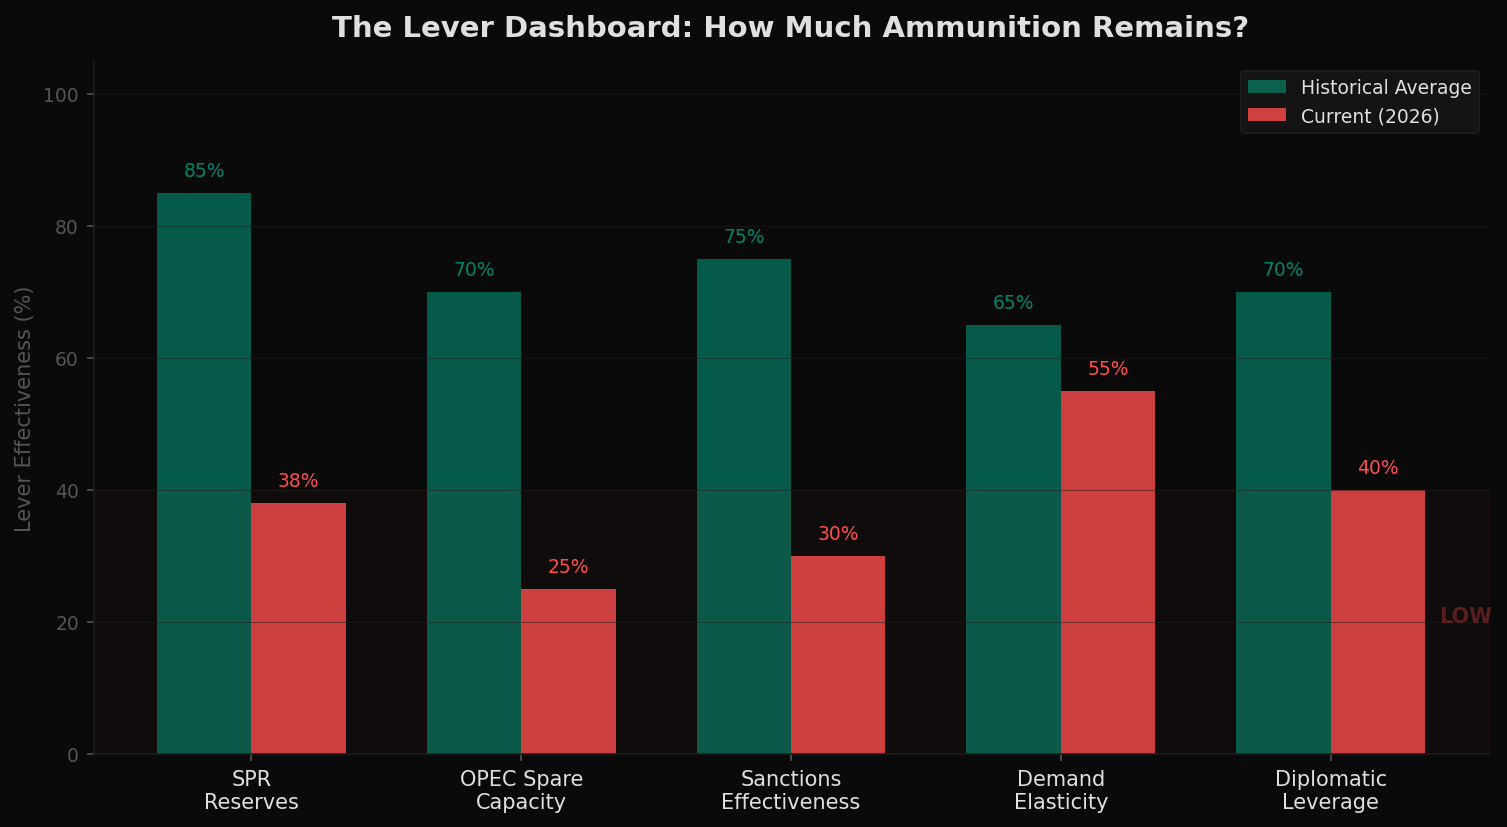
The SPR is at multi-decade lows. OPEC spare capacity is the thinnest it has been entering any major crisis. Sanctions on Iran were already in place and already leaking before the conflict escalated. Demand destruction has not yet engaged. Diplomatic channels are active but have not produced results.
The data does not tell you what will happen next. It tells you what tools are available — and at what capacity — when it does.
Implications
Every oil crisis in the past fifty years has been met with the same sequence of interventions. The pattern is not a coincidence — it reflects the limited set of tools available to any government facing an energy supply shock. What varies is not the playbook but the starting conditions.
The playbook hasn't changed. What's changed is how much ammunition is left.
Whether the current crisis follows the historical pattern to its conclusion — demand destruction, potential recession — or whether it resolves through mechanisms not yet visible in the data is a question the coming months will answer. The historical record, at minimum, suggests the tools available to prevent that outcome are operating at reduced capacity.
Data Sources & Methodology
Oil price data sourced from FRED (series WTISPLC, daily WTI spot) and Yahoo Finance (CL=F continuous front-month futures). SPR inventory data from the U.S. Energy Information Administration weekly reports (series WCSSTUS1). CPI data for inflation adjustment from FRED (CPIAUCSL). NBER recession dates from FRED (USREC). OPEC spare capacity estimates drawn from EIA Short-Term Energy Outlook archives and IEA Oil Market Reports. Iranian export volumes compiled from EIA, IEA, and tanker-tracking reports. Global oil demand figures from IEA Oil Market Reports. The lever sequence timing (Figure 2) and lever dashboard scores (Figure 8) are constructed from historical records and represent the author's assessment. All charts reflect data through early April 2026.
This analysis is for educational and informational purposes only. It does not constitute financial advice. All models are simplifications of reality — past patterns do not guarantee future outcomes.