In an earlier piece we argued that the binding constraint on artificial intelligence was not compute but memory — bandwidth, power, and the physics of moving bits. The thesis resolved faster and more violently than we expected. Over twelve months the two purest expressions of the memory supercycle, Micron and SanDisk, went near-vertical. One rose roughly ninefold. The other rose more than fortyfold.
This piece is not about whether that move was justified. It is about the shape of it. Because a parabola is not a price level or a percentage gain. It is a confession. It is the market revealing that the thing driving the price up is, increasingly, the price going up. Demand is no longer responding to value; it is responding to demand. When that loop closes, the curve stops being exponential and becomes something with a mathematical name and a mathematical fate.
What follows is a dissection. We will take the runs apart with the only tools that can actually tell a parabola from a steep trend — a differential equation, a critical exponent, and the curvature of a line on a logarithmic chart — and show that the most spectacular move of the two is, by the mathematics, not the parabola at all.
Three Regimes of Growth
There are only three ways a price can rise, and they are separated not by speed but by the behavior of their growth rate.
The first is linear: the price adds a fixed amount each period. Arithmetic, slow, the growth of a thing constrained by supply. The second is exponential: the price adds a fixed percentage each period. This is compounding — the growth of a healthy trend, a momentum stock, a business expanding at a steady clip. It looks dramatic on a normal chart, but its growth rate is constant. The third is super-exponential: the percentage growth rate itself increases over time. This is the parabola. And it is the only one of the three that ends in a mathematical wall.
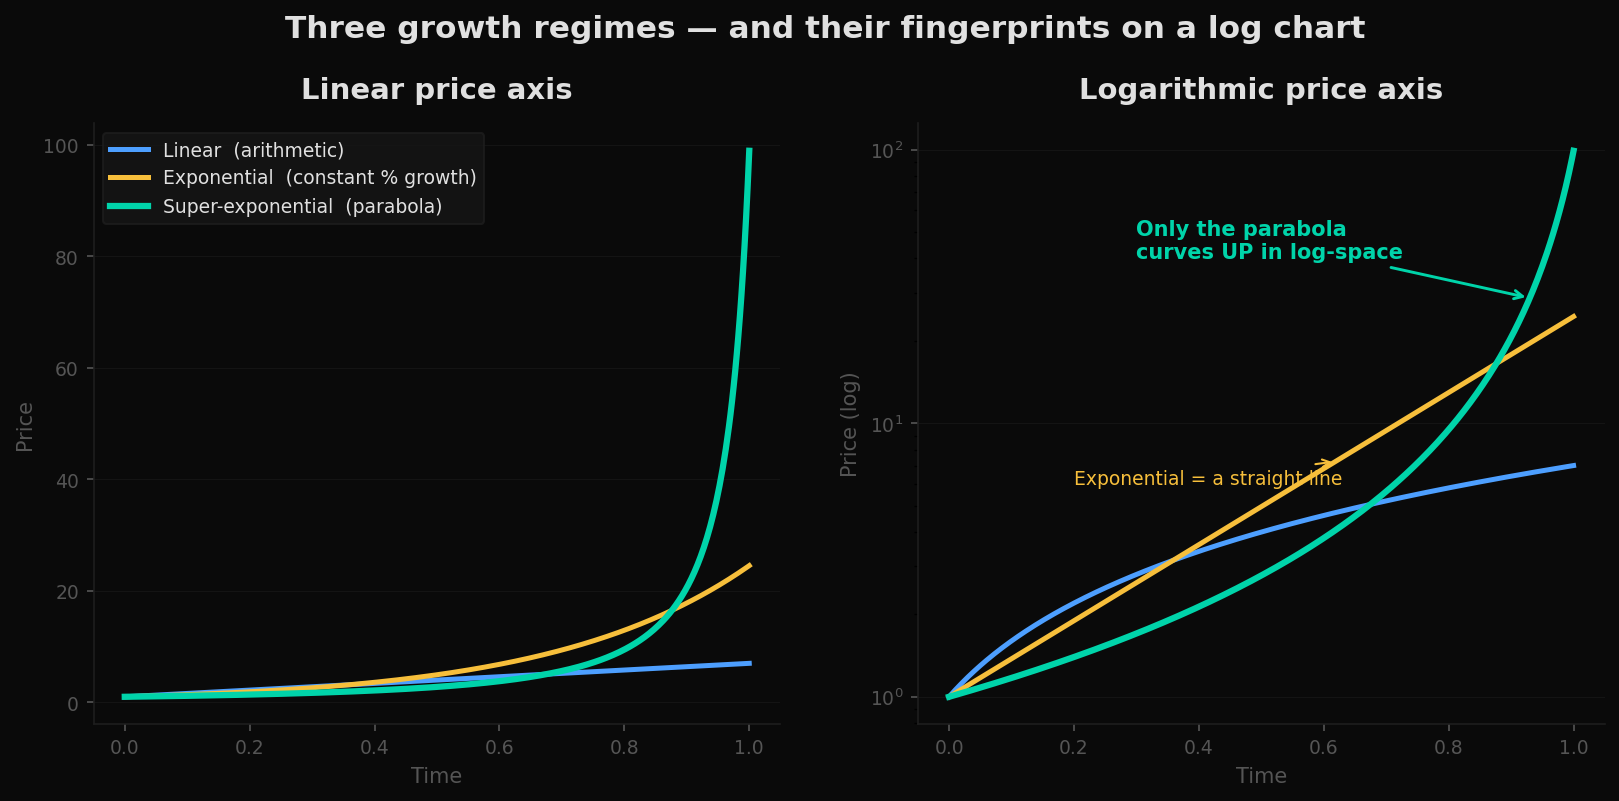
This is the most useful idea in the article, so it is worth stating plainly. Switch any chart to a logarithmic price axis. If the rising line is straight, you are looking at exponential growth — a trend. If the line curves upward, you are looking at a parabola. The eye cannot reliably distinguish the two on a normal axis, where every strong uptrend looks like it is "going parabolic." The log axis separates them instantly, because it removes the visual distortion of compounding and leaves only the residual curvature behind.
The Master Equation
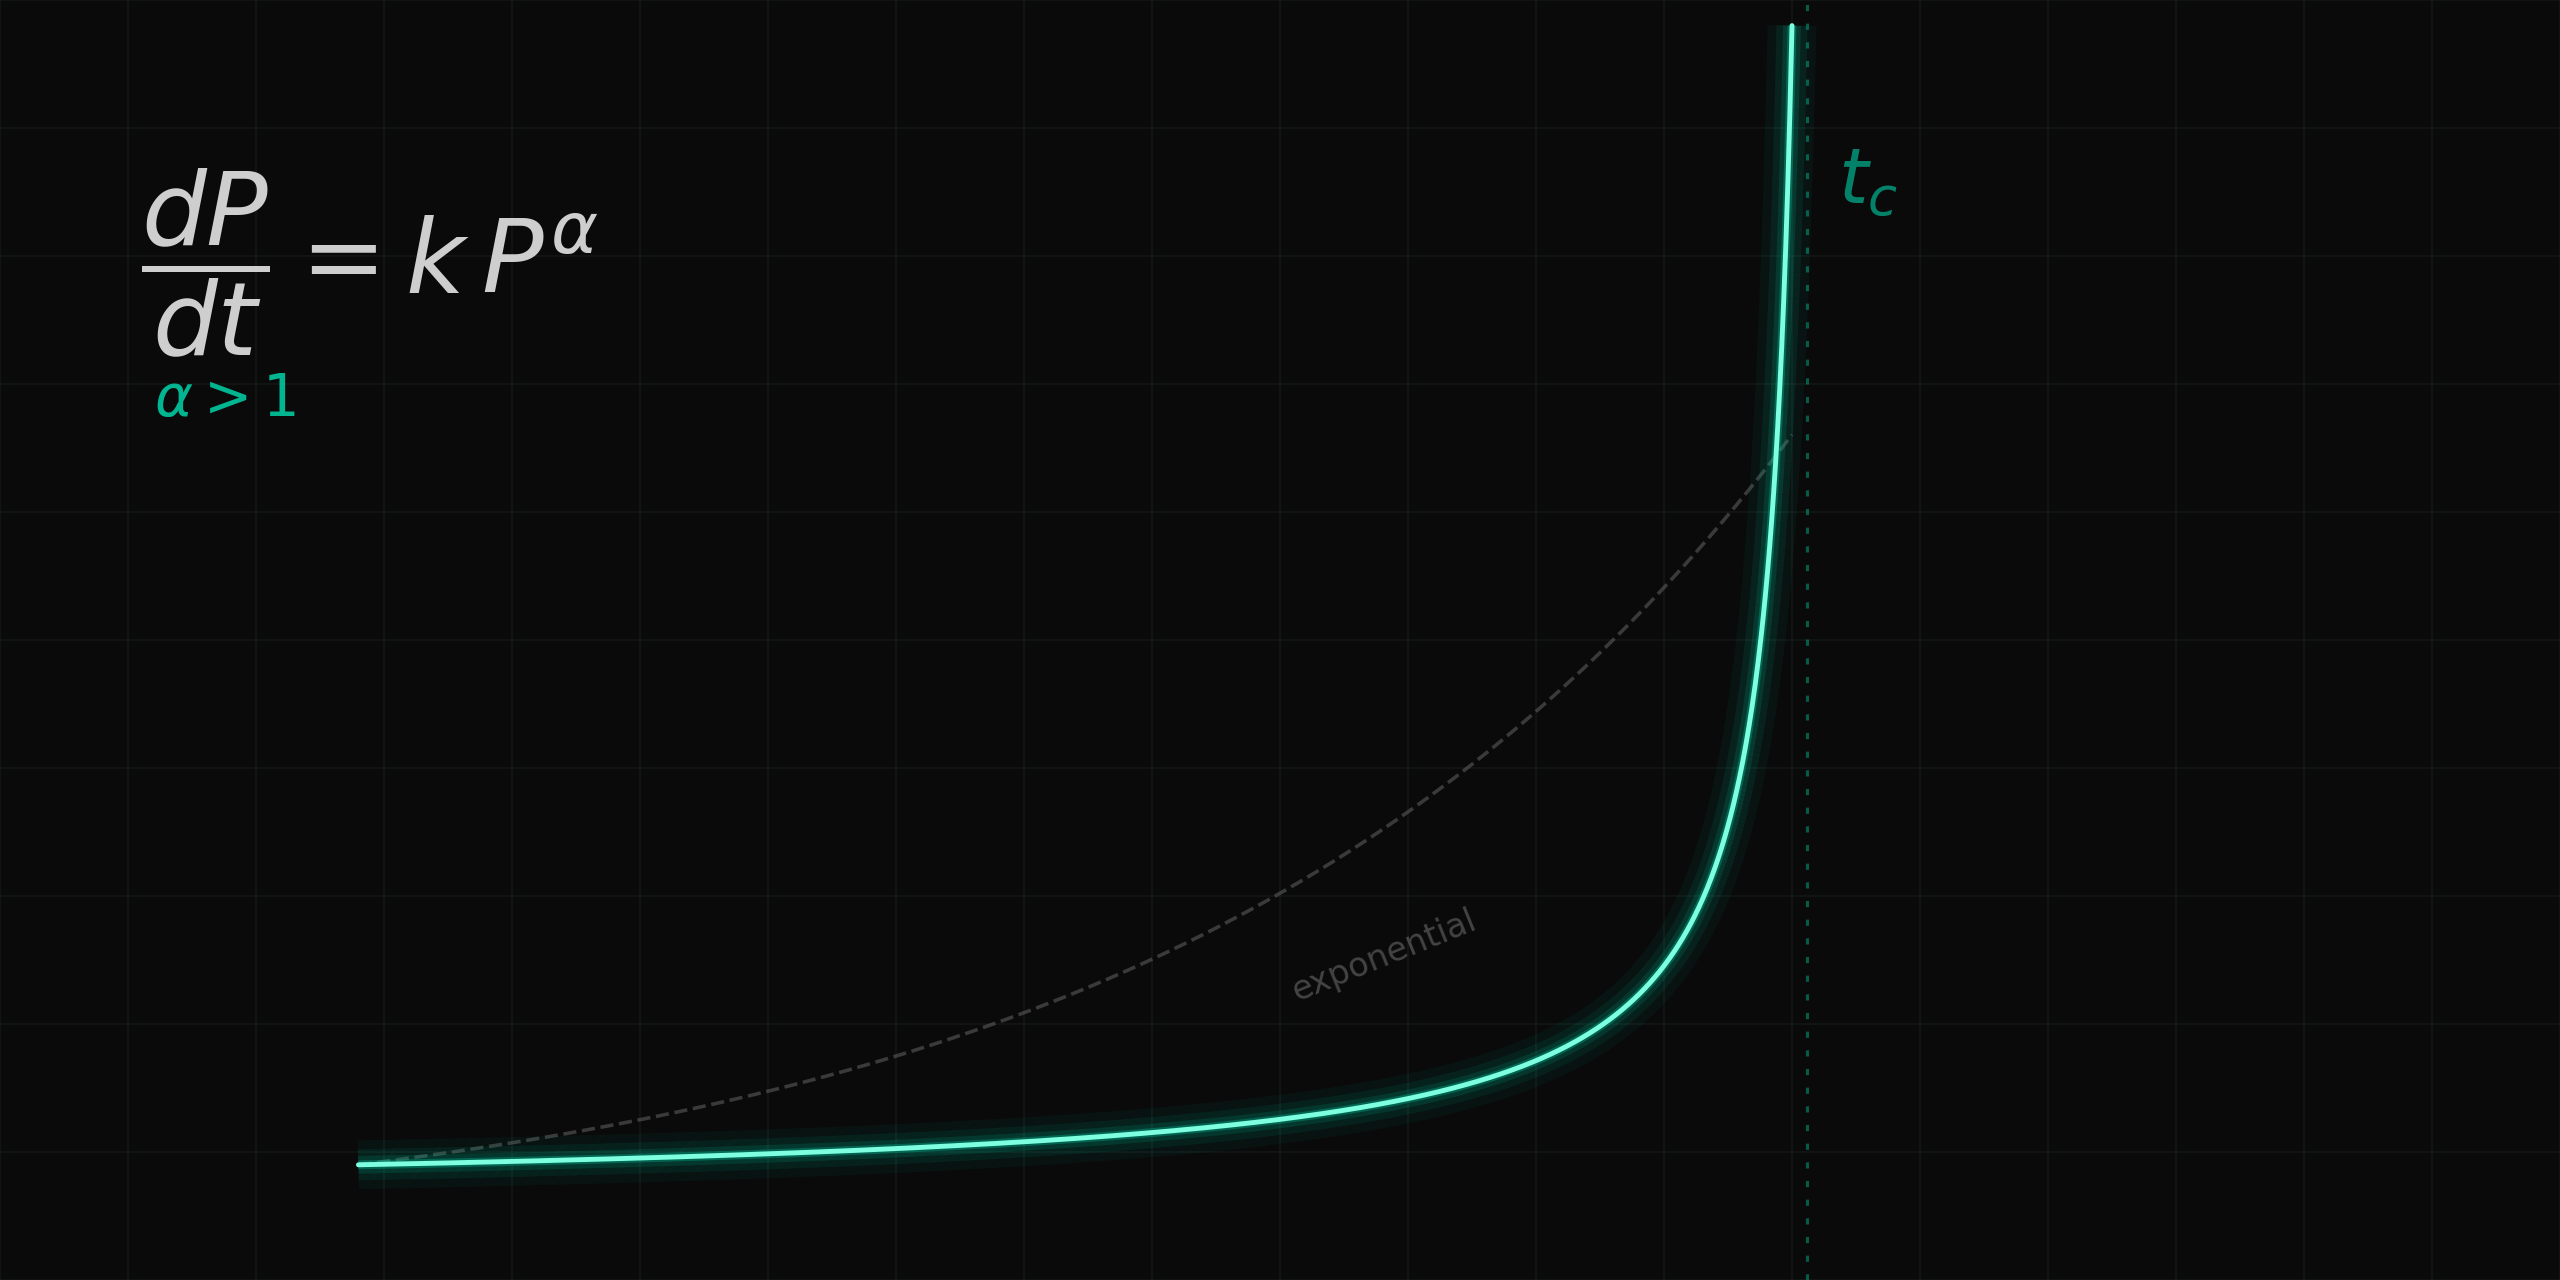
Behind that curvature is a single differential equation. Let the rate of change of price be proportional to some power of the price itself:
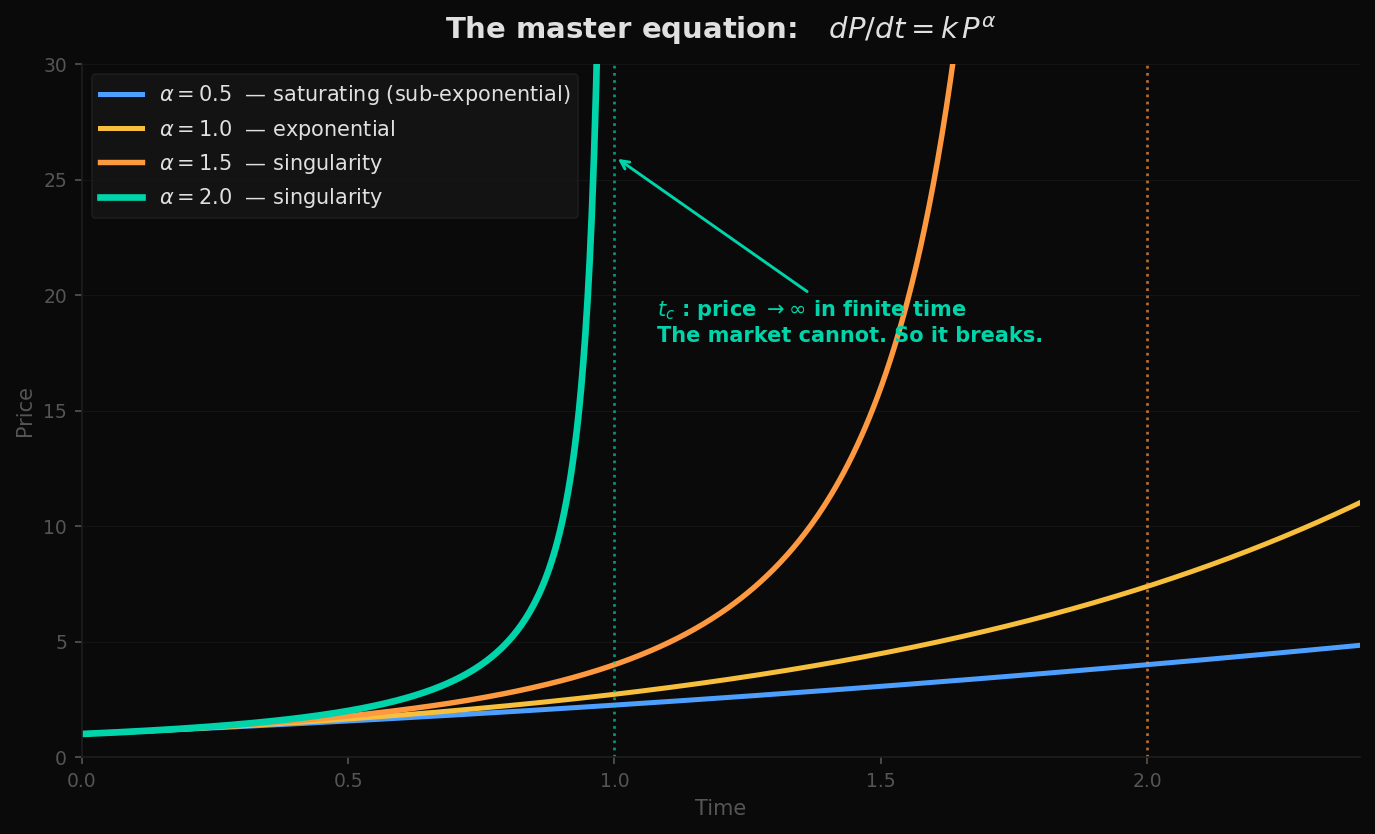
dP/dt = k · Pα
The exponent α is everything. It encodes how strongly the price's own level feeds back into its rate of advance — the intensity of the reflexive loop. The equation has three solutions, one for each regime, and they are not subtly different. They are categorically different.
- When α < 1, the feedback is sub-linear. Each gain produces a proportionally smaller next gain. The price rises, but decelerates — it saturates. This is a maturing trend running out of fuel.
- When α = 1, the rate of change is exactly proportional to the price. This integrates to pure exponential growth, P(t) = P₀·ekt — constant percentage compounding, the straight line on a log chart.
- When α > 1, the feedback is super-linear. And here the mathematics does something startling: the solution does not approach infinity gradually. It reaches infinity in finite time. There exists a specific moment — the critical time tc — at which the solution blows up entirely.
The finite-time singularity is the whole story. A price cannot actually reach infinity — there is not enough capital in the world, and the supply of greater fools is bounded. So the singularity is never reached. Instead, the approach to it becomes physically impossible, and the curve breaks. A parabola is the market attempting to divide by zero. The crash is not an accident that befalls the parabola afterward; it is encoded in the same equation that produced the rise. The blow-off and the collapse are two halves of one solution.
Case One: Micron
Fitting the master equation to Micron's run requires only one judgment — that the price follows a finite-time singularity — and then lets the data choose the exponent α and the critical time tc. We fit two models to the log-price: a straight exponential trend, and the super-exponential singularity. The comparison is the test.
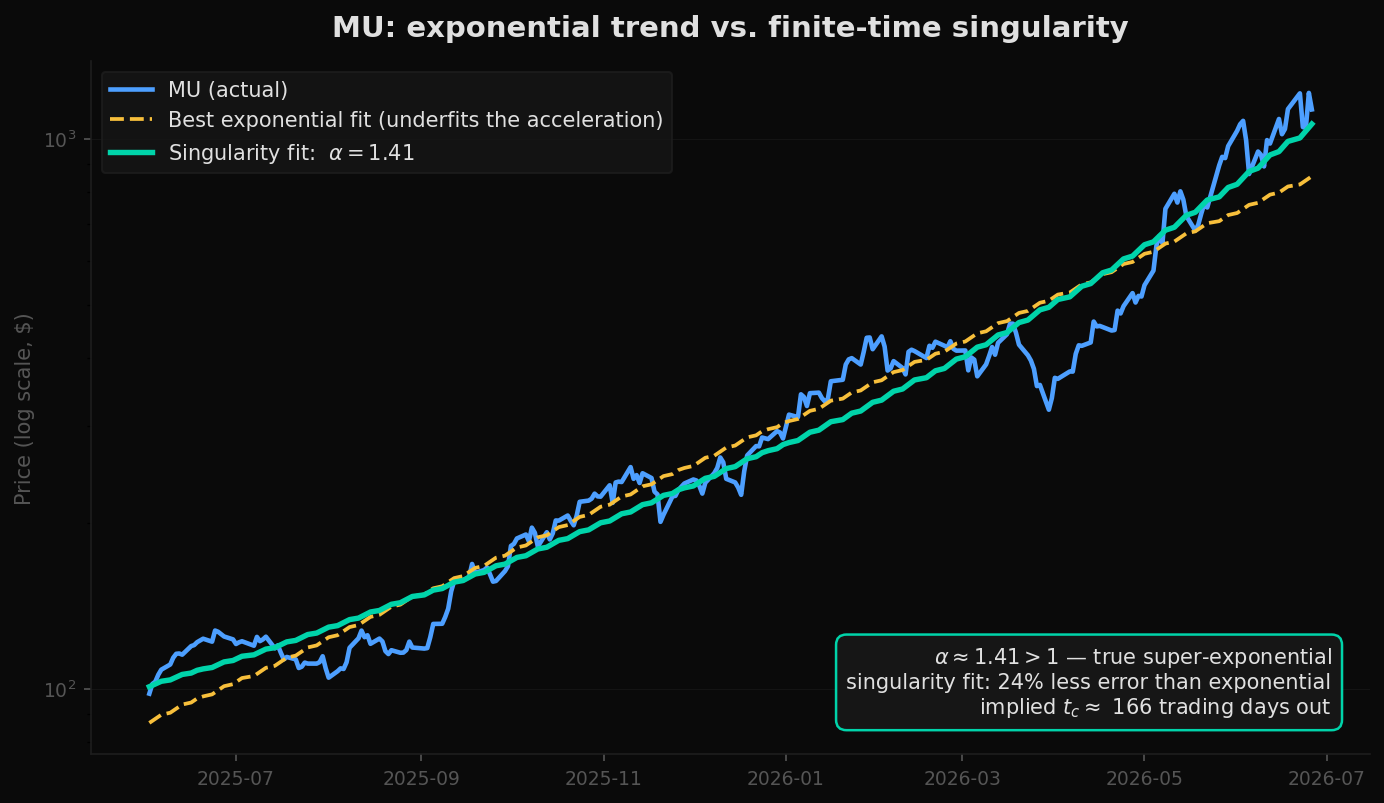
Two things matter in that fit. First, α ≈ 1.41 is meaningfully greater than 1 — the feedback is super-linear, and the curve is genuinely accelerating, not merely fast. Second, the singularity model is not just a better story; it is a measurably better fit, reducing error against the actual path by roughly a quarter. On a log axis, where exponential growth would be a ruler-straight line, Micron's price visibly curls upward. That curl is the signature. The implied critical time lands a few months beyond the window — close enough to matter, which is precisely what makes a live parabola dangerous.
Case Two: SanDisk — the Bigger Move That Isn't a Parabola
SanDisk's run was the more spectacular of the two by a wide margin — more than fortyfold against Micron's ninefold. By every intuition built on the size of the move, it should be the more extreme parabola. The mathematics says the opposite.
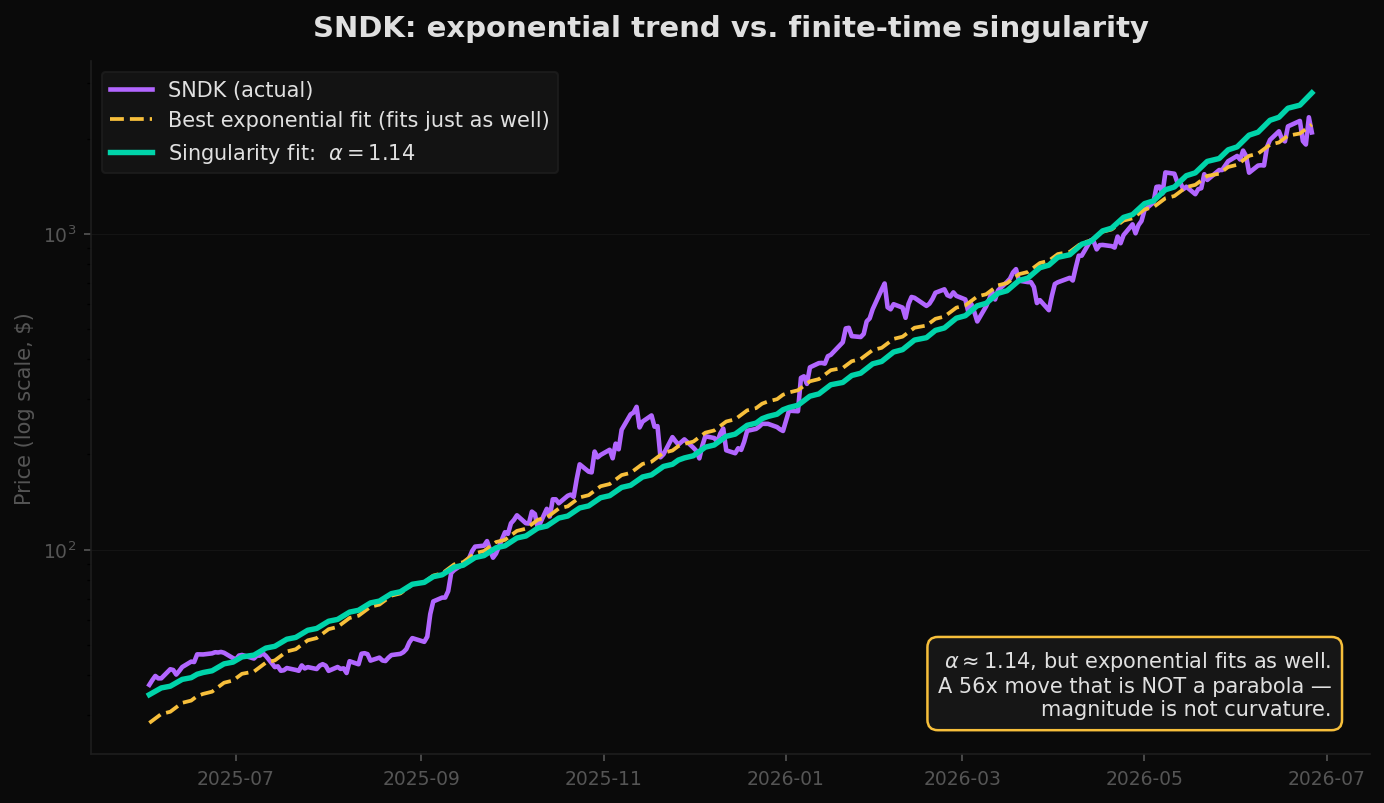
This is the central, non-obvious result of the dissection. The magnitude of a move tells you nothing about whether it is a parabola. SanDisk rose far more than Micron, but it did so at a roughly constant compound rate — an extraordinarily steep straight line on a log chart, not an upward curve. Its enormous total return is the product of a high growth rate sustained over time, not of an accelerating one. A move can be gigantic and still be structurally ordinary. A move can be modest and still be a true singularity. Size is the thing everyone watches; curvature is the thing that matters, and the two are independent.
The Tell Before the Top
If a parabola is defined by an accelerating growth rate, then the way to detect one early is not to guess where the top is — it is to measure whether the growth rate is rising. This is observable in real time, long before any apex, because it is a property of the curve's second derivative, not its level.
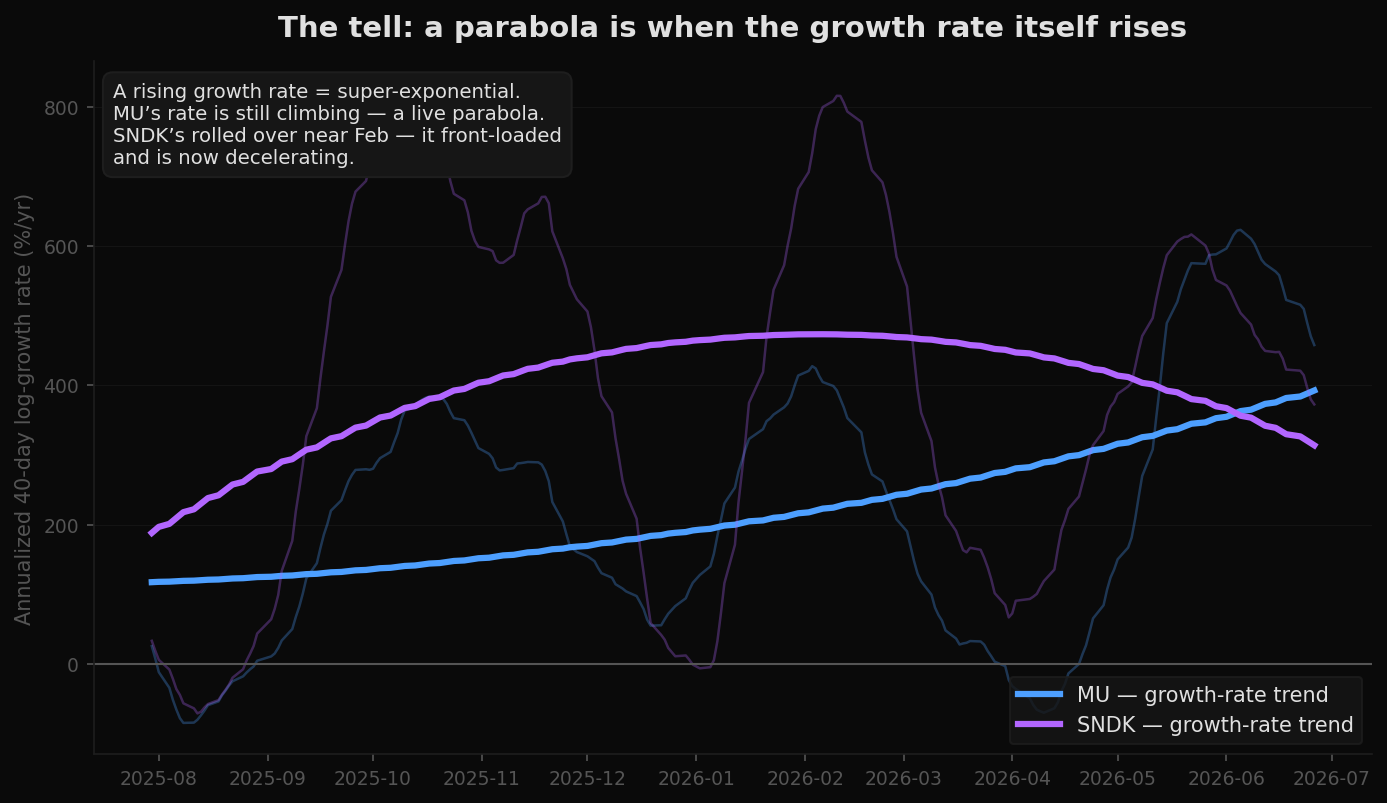
This reframes what it means to "see a parabola forming." You do not need the top. You need the curvature, and the curvature shows up in the growth-rate series well before the price peaks. A rising growth rate is the regime signal. A flattening one — even at a very high level, as with SanDisk — says the super-exponential phase is over even if the price is still grinding higher. The most violent part of a parabola is the stretch where the growth rate is not just high but still climbing.
The Log-Periodic Signature
There is a second, subtler fingerprint, and it is one of the more remarkable results in the physics of bubbles. As a parabola approaches its critical time, it does not rise smoothly. It oscillates — and the oscillations compress. Pullbacks arrive faster and faster, each retreat coming sooner than the last, in a geometric sequence that converges on tc. This is the log-periodic structure described by the physicist Didier Sornette, layered on top of the power-law rise.
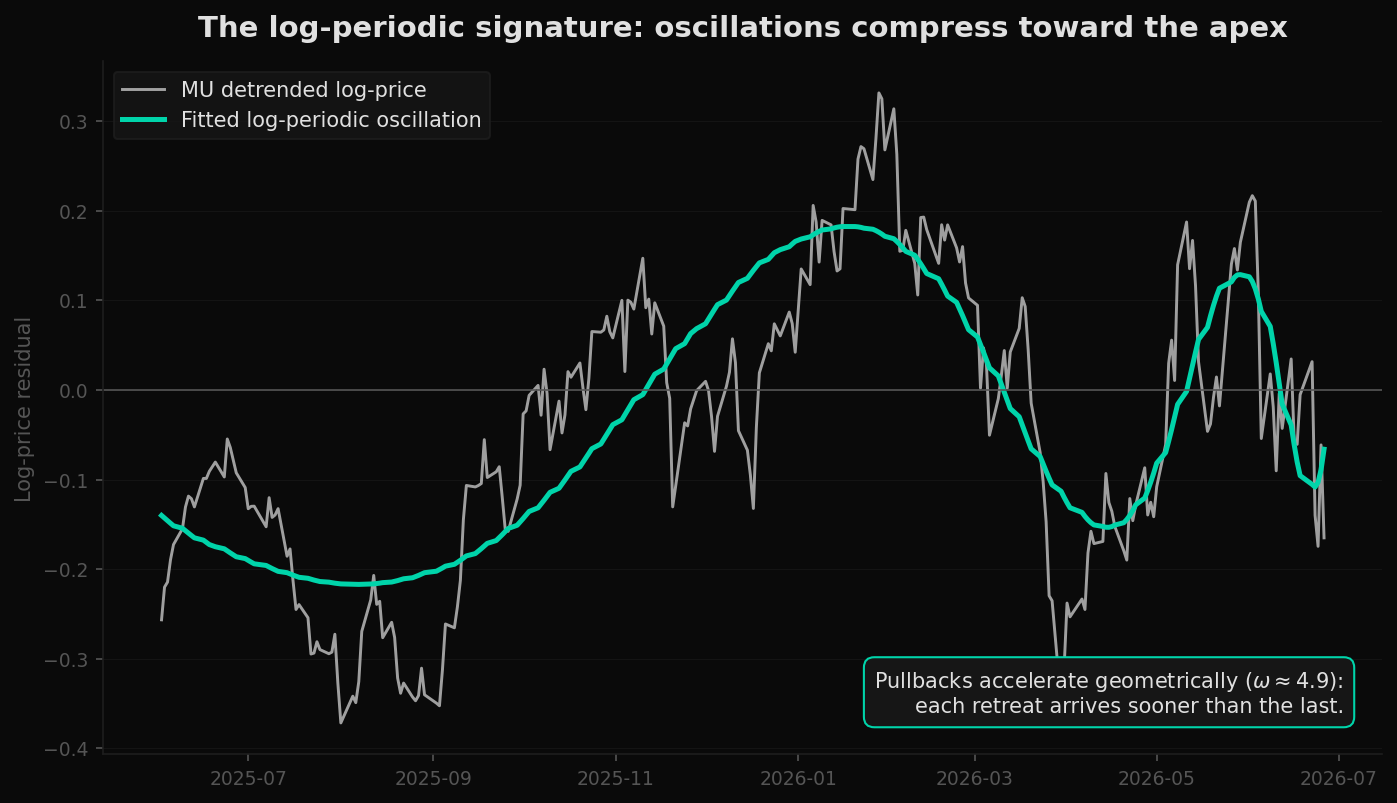
The intuition is that the same reflexive impatience driving the price also drives the timing of its corrections. As the crowd's time horizon shortens, the cycle of greed, doubt, and renewed greed runs faster. The dips that earlier took months to play out start resolving in weeks. When the rhythm of the pullbacks begins to accelerate visibly, the parabola is in its terminal phase. It is a clock, not just a trajectory — and it is ticking faster as it nears the wall.
Why the Exponent Exceeds One
None of this explains why α should ever rise above 1 in the first place. Markets are not governed by a differential equation; the equation is a description, not a cause. The cause is a feedback loop — a real, mechanical one, built from the microstructure of how a crowded stock trades.
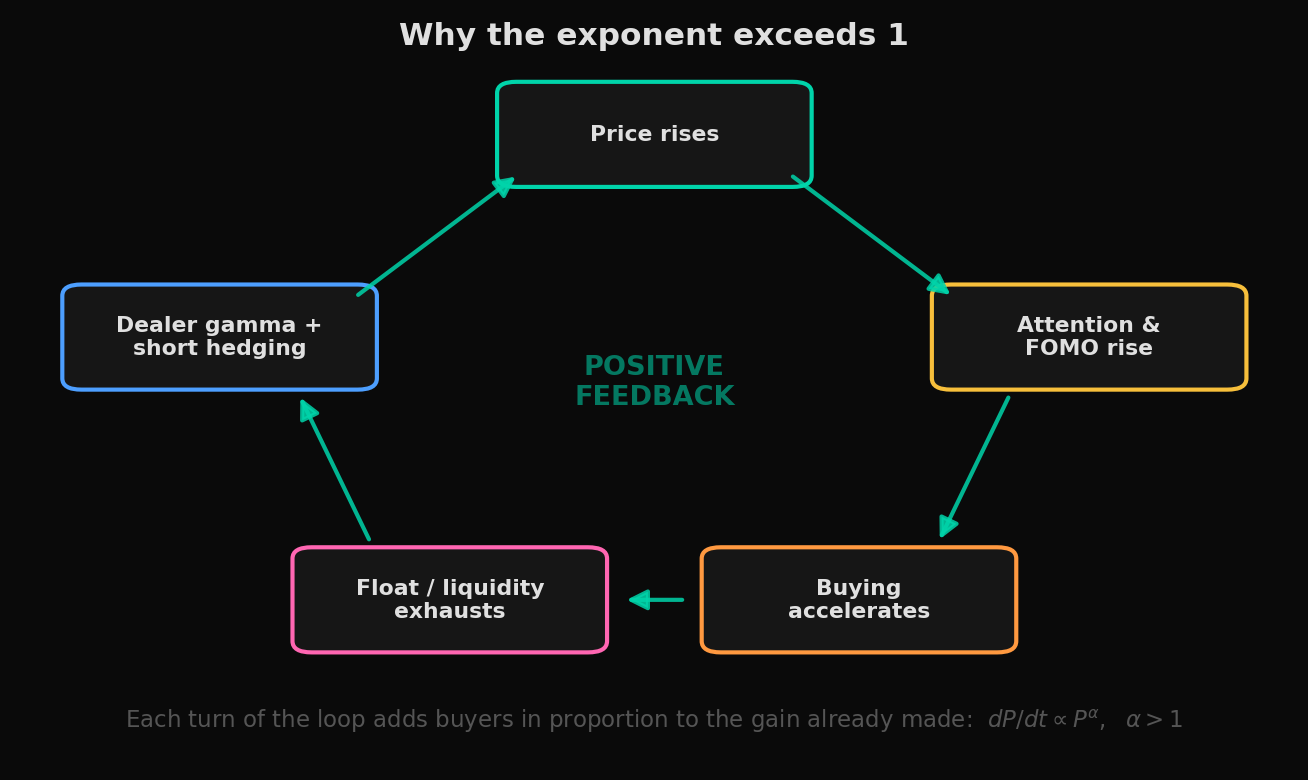
Several mechanisms stack to push α past 1. Reflexivity, in George Soros's sense: rising prices change the fundamentals that participants believe justify the price, so perception and price chase each other upward. Float exhaustion: as available shares are absorbed, each marginal buyer moves the price more, so identical demand produces a larger move. Dealer gamma: market-makers short call options must buy more stock as it rises to stay hedged, a mechanical bid that grows with the price. Passive and momentum flows: index inclusion and trend-following allocate capital because the price has risen, not in spite of it. Each of these makes the next increment of buying a function of the gain already realized. That is the precise mechanical meaning of a super-linear exponent.
An exponential trend is a market that has made up its mind. A parabola is a market that has stopped having one — where price has become its own reason, and the only remaining variable is when.
The Apex and the Aftermath
Because the singularity can never be reached, the parabola must resolve. And the same exponent that governs the rise governs the fall: the stronger the feedback that drove the ascent, the sharper the top and the faster the unwind. A parabola does not roll over gently. It is structurally asymmetric — a near-vertical run-up meeting a near-vertical collapse, with very little time spent near the peak.
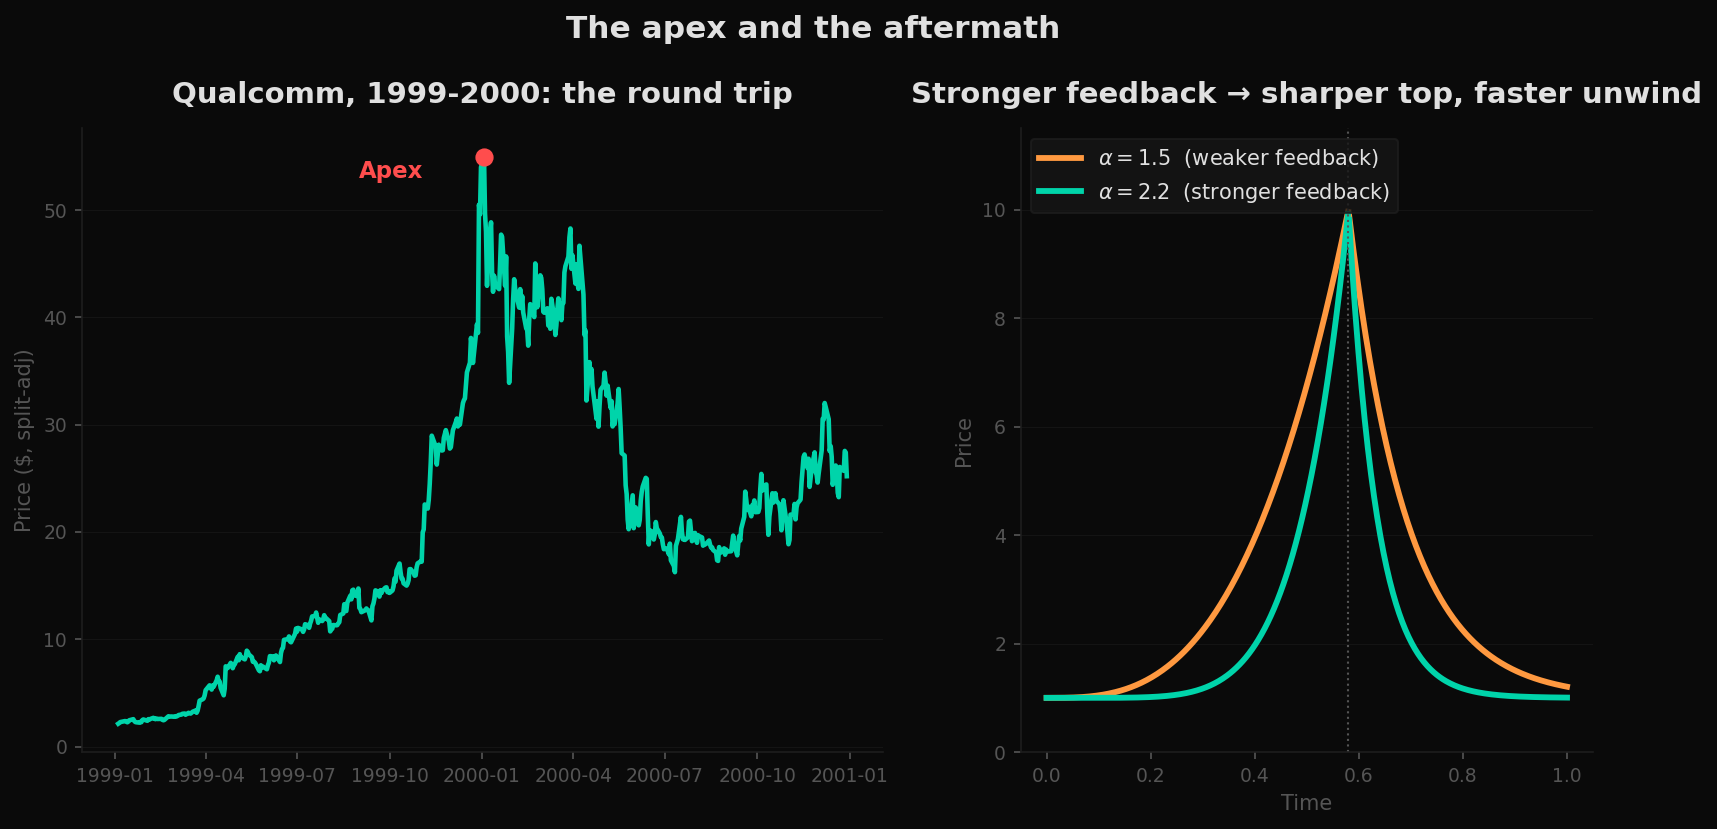
Qualcomm is the reference case because its cycle is complete. It ran on a real and durable thesis — wireless was genuinely about to remake communication — exactly as Micron and SanDisk run on a real memory-demand thesis today. A true thesis is not protection against a parabola; it is usually the fuel. The narrative gives the reflexive loop something to believe, and the belief is what lets price become its own justification. When the run resolves, the thesis can remain entirely intact while the price gives back most of the move. The mathematics of the shape and the truth of the story are independent questions.
Implications
The practical content of all this is small, sharp, and easy to misuse, so we will state it carefully. A parabola is a regime, not a price target. Identifying one tells you something about the character of a move — that it is reflexive, accelerating, and carrying an encoded deadline — without telling you the date or the level of the top. The critical time tc is an estimate that wanders as new data arrives; it marks a zone of fragility, not an appointment.
What the dissection does offer is a way to look. Put the chart on a log axis. If the line is straight, you have a trend, however steep — and steepness alone, as SanDisk shows, is not a parabola. If the line curves upward, measure whether the growth rate is still rising or has begun to roll over. Watch whether the pullbacks are compressing. These are observations available before the apex, and they are about the shape of the curve rather than a forecast of its end.
Two stocks rode the same supercycle to enormous gains. One bent space around itself; the other simply ran fast in a straight line. The crowd will call both of them parabolic, and the crowd will be half wrong. The mathematics is indifferent to the size of the move and the truth of the story. It cares only about the curvature — and the curvature, unlike everything else, you can measure while it is still happening.
Data Sources & Methodology
Price series for Micron (MU) and SanDisk (SNDK) cover roughly June 2025 through June 2026; Qualcomm (QCOM) covers 1999–2000, split-adjusted. Daily closing prices are sourced from public market data and cleaned of isolated erroneous prints. The "master equation" dP/dt = k·Pα is integrated in closed form; the finite-time singularity solution P(t) = P₀·(1 − t/tc)−1/(α−1) is fit to log-price by non-linear least squares with a multi-start search over the critical time tc, since the model is degenerate in the limit tc → ∞ (where it reduces to a pure exponential). Fit quality is compared against a best-fit exponential by residual sum of squares; a run is classified as a parabola only when the singularity model reduces error by a meaningful margin. The log-periodic structure follows the Johansen–Ledoit–Sornette (LPPL) specification, with the oscillation term fit by multi-start least squares over the angular log-frequency ω. Recovered values of α, tc, and ω are estimates conditioned on the chosen window and are sensitive to it; they are presented to illustrate structure, not to forecast price. The reflexivity framing draws on George Soros's theory of reflexivity and on Didier Sornette's work on log-periodic power-law bubbles. All figures reflect data and estimates as of June 2026.
This analysis is for educational and informational purposes only. It does not constitute financial advice. The models described identify the statistical character of past price behavior and carry no predictive guarantee; critical-time estimates are uncertain and should never be used as entry or exit signals. Parabolic moves are exceptionally hazardous in both directions. Nothing here should be used as the basis for investment decisions.